Our customers frequently tell us that despite being very effective DevOps practitioners, they still struggle to build a data-driven DevOps culture. They find it especially hard to answer the fundamental question:
What are the right things to measure?
This becomes more challenging in enterprise organizations when there are hundreds of different development groups, and there's no normalization between how things are done or measured. Because of this, we see a strong interest from customers for metrics that would allow them to standardize between teams and benchmark themselves against the industry.
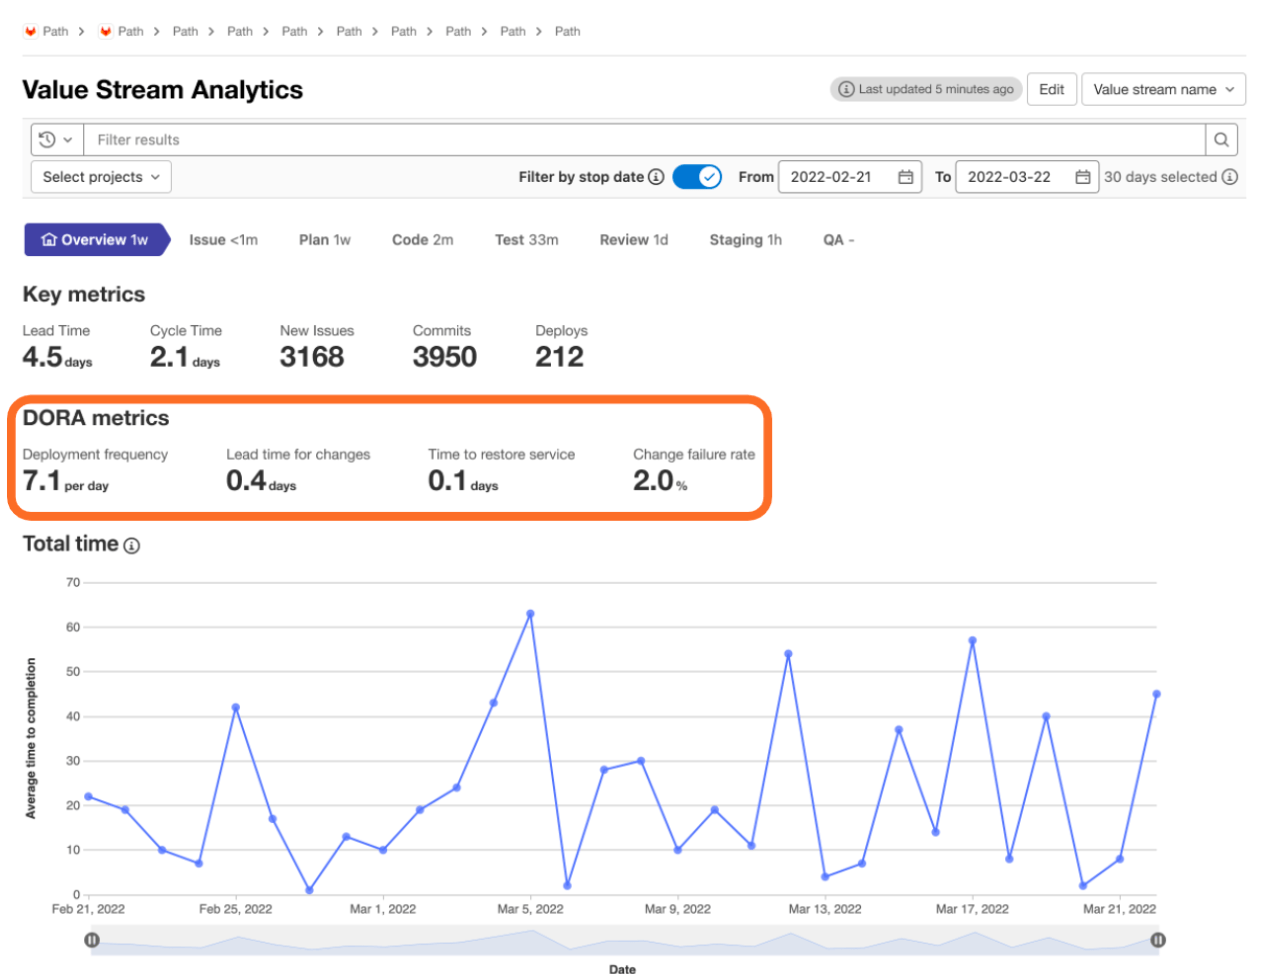
 Value Streams Analytics helps you visualize and manage the DevOps flow from ideation to customer delivery.
What Are DORA Metrics?
With the continued acceleration of digital transformation, most organizations realize that technology delivery excellence is a must for long-term success and competitive advantage. After seven years of data collection and research, the DORA's State of DevOps research program has developed and validated four metrics that measure software delivery performance: (1) deployment frequency, (2) lead time for changes, (3) time to restore service and (4) change failure rate.
In GitLab, The One DevOps Platform, Value Stream Analytics (VSA) surfaces a single source of insight for each stage of the software development process. The analytics are available out of the box for teams to drive performance improvements.
What does DORA bring to Value Stream Analytics?
Value Stream Analytics (VSA) measures the entire journey from customer request to release and automatically displays the overall performance of the stream. Each stage in the value stream is transparent and compliant in a shared experience for everyone in the company.
This makes the VSA the single source of truth (SSoT) about what's happening within the entire software supply chain, with DORA’s metrics as the key measure of the value stream outputs.
How do Value Stream Analytics work?
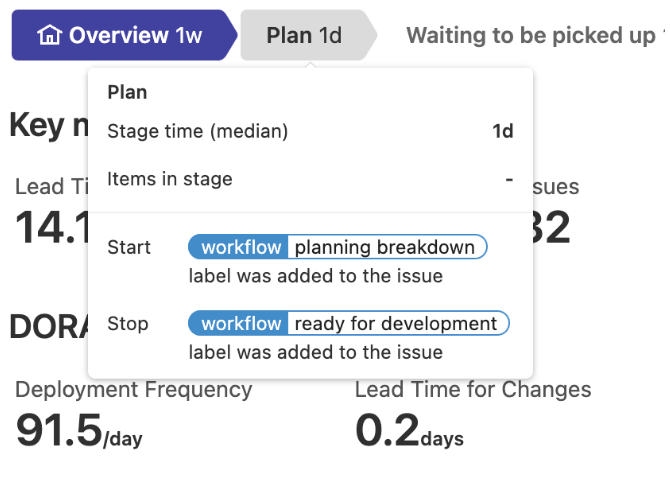
Value stream analytics measures the median time spent by issues or merge requests in each development stage.
As an example, a stage might begin with the addition of a label to an issue and end with the addition of another label:
 Value stream analytics measures each stage from its start event to its end event.
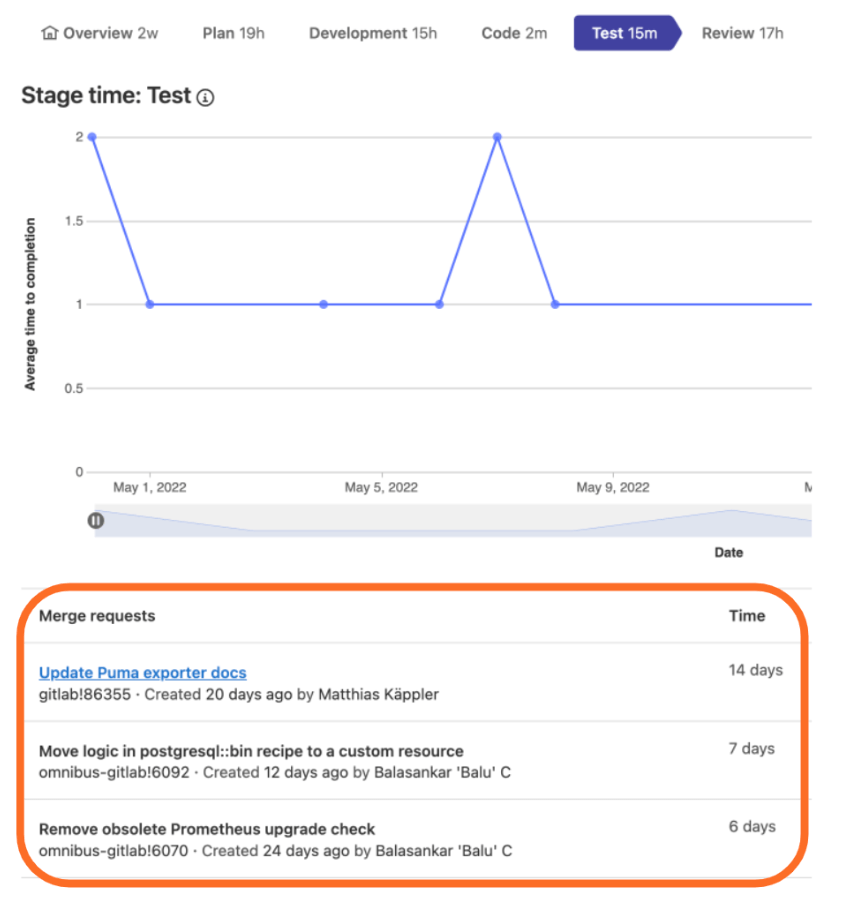
For each stage, a table list displays the workflow items filtered in the context of that stage. In stages based on labels, the table will list Issues, and in stages based on Commits, it will list MRs:
 The VSA MR table provides a deeper insight into stage time breakdown.
The tables provide a deep dive into the stage performance and allow users to answer questions such as:
- How to easily see bottlenecks that are slowing down the delivery of value to customers?
- How to reduce the time spent in each stage so I can deliver features faster and stay competitive?
- How can we develop code faster?
- How can we hand off to QA faster? How can we push changes to Production more quickly?
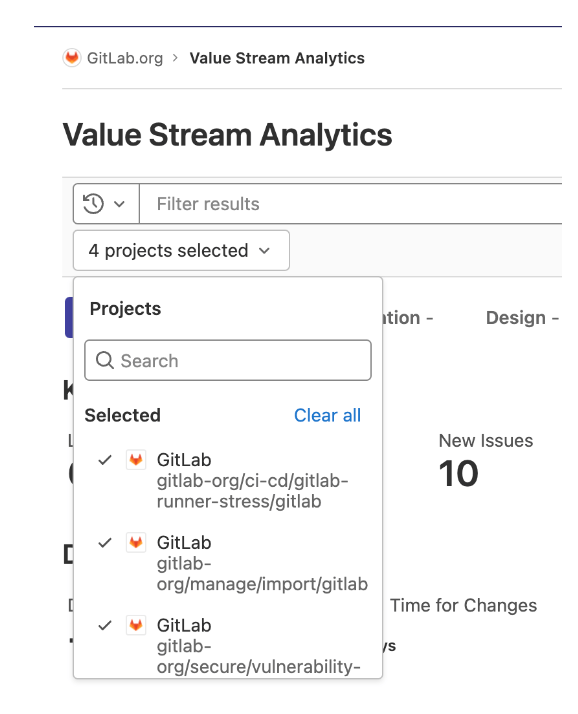
Using the Filter results text box, you can filter by a project (example below) or parameter (e.g., Milestone, Label).
 Value stream analytics filtering.
No login is required to view Value stream analytics for projects where you can become familiar with stream filtering, default stages and deep-dive tables. For a full view of the DORA metrics, you have to log in with your GitLab Ultimate-tier account or sign up for a free trial.
How to understand DevOps maturity and benchmark progress with the DORA metrics?
DORA metrics can also provide answers to questions not related to VSA, such as:
- How to become an elite team of DevOps professionals?
- How do I perform vs. industry standards?
- Is the organization better at DevOps this year than last?
Learn more about VSA and DORA:
- Check out the GitLab Speed Run about DORA metrics in VSA:


